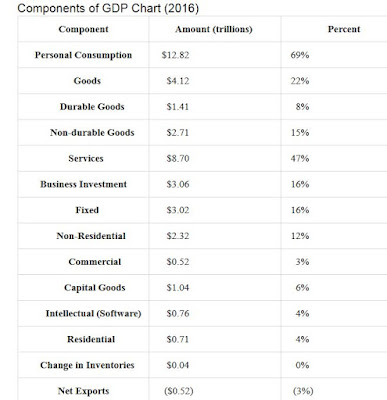
Net exports have been negative since, I believe, 1977 so that it always is a drag on the GDP.
But first, GDP can be complicated as not all spending is counted. A LOT of spending can go on that isn't counted. For example on business spending:
Business investment includes purchases that companies make to produce consumer goods. But, not every purchase is counted. If a purchase only replaces an existing item, then it doesn't add to GDP and isn't counted. Purchases must go toward creating new consumer goods to be counted.**
So a lot of equipment replacement spending could be going on, and it would not be reflected in the GDP.
..................................................................
Fixed investment also includes residential construction, which includes new single-family homes, condos and townhouses. Just like commercial real estate the BEA doesn't count housing resales as fixed investments.**
So a lot of existing home sales could be going on, and they would not be reflected in the GDP. In fact, there is a shortage of new homes now.
...................................................................
The example of government spending includes state and local governments as well as the Federal government:
Government spending [has decreased also putting a drag on the GDP] was $3.27 trillion in 2016. That's 18 percent of total GDP. It's less than the 19 percent it contributed in 2006. In other words, the government was spending more when the economy was booming before the recession. That's exactly when it should have been spending less to cool things off**.
I think state and local government spending has not fully recovered since the Great Recession. Federal spending has been hampered by the sequester.
For more details, see the reference. The figure on GDP by quarter is given below:
Here is the table from the reference.** I had to piece the table together in two pieces and apologize that they don't fit in perfect vertical alignment.
* https://www.cnbc.com/2017/11/24/the-fed-launched-qe-nine-years-ago--these-four-charts-show-its-impact.html
https://www.statista.com/statistics/188185/percent-chance-from-preceding-period-in-real-gdp-in-the-us/
https://www.bea.gov/newsreleases/national/gdp/gdphighlights.pdf
** https://www.thebalance.com/components-of-gdp-explanation-formula-and-chart-3306015
***


No comments:
Post a Comment