In 2017, total U.S. trade with foreign countries was $5.2 trillion. That was $2.3 trillion in exports and $2.9 trillion in imports of both goods and services. The United States was the world's third-largest exporter, after China and the European Union. It was the world's second-largest largest importer after the EU. * Russia comes in at number 24 on the list of countries by imports.
In 2017, the U.S. had a trade deficit of $502 billion.
It seemed to be China that bothers President Trump; however, the top 10 countries from which we import steel in 2017 does not include China but does include many of our allies (see figure):* This situation is in flux and keeps changing as President Trump does seem to be using the tariffs as a bargaining tool in NAFTA negotiations with Canada and Mexico to decrease their large steel exports to the U.S.

There is some confusion in the figures, however, because a report in 2016 said that China was the 7th largest exporter of steel to America. The problem arises because the Chinese were dumping steel just a few years ago. Then President Obama had negotiations with China on the promise that China will work toward cutting overproduction of steel. Chinese cuts in steel production were promised again in 2017.* As a result, now China is a minor exporter of steel to the U.S. but promised to cut steel production even further in March of 2018.
The largest items in various categories of Exports and Imports are listed below. As for aluminum, 63% of imports come from Canada. About 99% of aluminum ore (bauxite) must be imported for American smelters. Canada is also the largest exporter of steel to the U.S., about 36%, but it is also the largest importer. Exports from America to Canada are about 50% of America's steel exports.
Among the largest U.S. exports 2017 are (in $U.S. billions):**
Capital and Consumer Goods
Automobiles:10 percent of all exported goods ($158)
Commercial aircraft ($121).
Chemicals ($77)
Petroleum products ($71)
Pharmaceuticals ($51)
Services
Travel services ($291)
Computer and business services ($191)
Royalties and license fees ($124).
Private services, such as financial services, added $121 billion.
Among the largest imports are (in $U.S. billions):**
Services
Travel and transportation ($236)
business and computer ($141)
Capital Goods
Computers ($128)
Telecommunications equipment, incl. semiconductors ($128).
Cell phone and TV ($121)
Consumer goods
Apparel and footwear ($123)
Pharmaceutical imports ($110)
Industrial Machinery And Equipment
Oil and petroleum products ($183)
Automobile
Automotive vehicles, parts, and engines ($359 billion)
Food, feeds and beverages ($138 billion).
The Labor Department’s producer-price index for goods used in construction industries— which include asphalt, concrete, diesel fuel and other materials—was up 4.9% year-to-year in January. In November, prices were up 5.6% on an annual basis, the steepest increase in seven years. A separate producer price index for steel-mill products was up 7.8% in 2017, according to the Labor Department.**
These price increases were already making any infrastructure program more expensive. Increasing the price of steel 25% and aluminum 10% will further add to the cost of any infrastructure program.
...........................................................
The housing industry, meanwhile, is grappling with tariffs on softwood lumber imposed last year that could boost home prices this year. Lumber futures have hit records on the Chicago Mercantile Exchange. The National Association of Home Builders estimates the tariffs will result in about 9,400 construction jobs lost while raising the price of the average single-family home by $1,360.**
Tax Reduction Act
I have warned that the results of the Tax Reduction Act may be different from what is expected because it all depends on how much stock buyback and debt payoffs by companies and taxpayers occurs.*** It is complicated because when a company buys back stock, the company of the person that has sold the stock to them gets the money and then what do they do with it? Paying down debt can be something else, but if a company or a person pays off debt, that money cannot be used for something profitable because it is gone. True the receiver of the debt paydown then has some money to do something with and, if they reloan it, perhaps something beneficial will come out of it. We'll just have to see how all this works out. And the proposed tariffs complicate the picture even further.
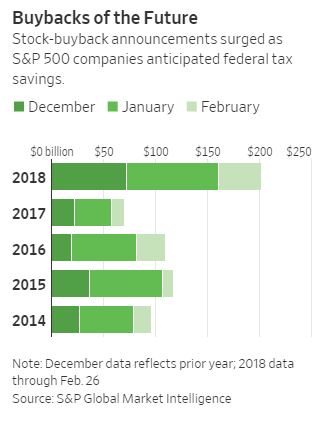
How spending as a result of the Tax Reduction Act is shaping up.
Share buybacks announced by large U.S. companies have exceeded $200 billion in the past three months, more than double the prior year, according to a Wall Street Journal analysis of data for S&P 500 companies.****
* https://en.wikipedia.org/wiki/List_of_countries_by_imports
https://www.trade.gov/steel/countries/pdfs/imports-us.pdf
http://www.xinhuanet.com/english/2017-03/05/c_136104886.htm
https://www.ft.com/content/e62e3722-fee2-11e5-ac98-3c15a1aa2e62
http://abcnews.go.com/International/wireStory/china-sets-2018-growth-target-65-percent-53509631
** https://www.thebalance.com/u-s-imports-and-exports-components-and-statistics-3306270
https://www.wsj.com/articles/trumps-proposed-tariffs-risk-hobbling-infrastructure-plan-1520191916?mod=searchresults&page=1&pos=1
*** http://stopcontinentaldrift.blogspot.com/2017/12/dont-be-fooled-by-congressional-tax-plan.html
http://stopcontinentaldrift.blogspot.com/2018/02/new-tax-plan-and-corporate-taxes.html
**** https://www.wsj.com/articles/boom-in-share-buybacks-renews-question-of-who-wins-from-tax-cuts-1519900200?mod=searchresults&page=1&pos=4
No comments:
Post a Comment